As the classic said, the salvation of drowning people is the work of the drowning people themselves. With regard to our topic, we can say: heating the freezing is the work of the freezing themselves. Of course, if you live in a mansion or a country house equipped with a unique system, it is enough to set the automated temperature control system to the required temperature schedule and heat supply mode. Everything else should happen without your participation. All that is needed is to choose the indoor temperature that will provide you with proper comfort.
Another thing, if we are talking about multi-apartment residential buildings that are connected to centralized heat supply systems. Here, residents need to keep an eye out and monitor compliance with the heating temperature schedule by public forces, provided, of course, that the management company has withdrawn from this task. In this case, there is a chance to get the heat provided for in the temperature schedule in your apartments. It should be compiled by the heating technicians of the heat supply organization, taking into account the climatic and seasonal conditions of your area.
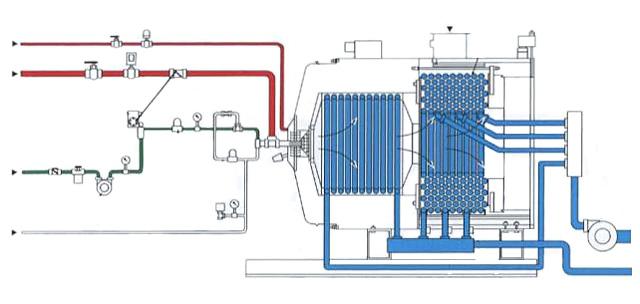
The temperature schedule of heating is calculated based on the average temperature of the coldest five days, the specified temperature and length, as well as the configuration of the heating system itself. Be sure to take into account heat loss at the exit from the source of the heat supply (CHP or boiler) to the place of direct entry into the building. A CHPP is a cogeneration plant or a thermal power plant that produces, in addition to electric energy, also heat, which in turn is released to consumers in the form of hot water and steam.
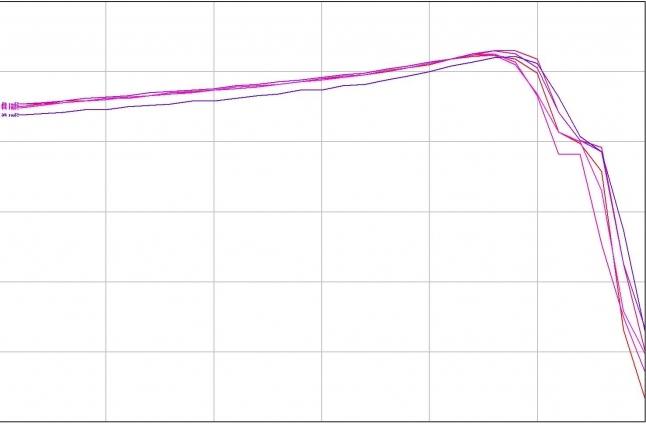
It is expressed in two digits: 95/70, for example. The first digit indicates the temperature of the coolant in the network - water - to the maximum, the second - to the minimum. The temperature schedule of a boiler house or CHP plant supplies heat from boiler rooms and low-power CHP plants. It can be from large thermal power plants: 150/70 or 105/70 degrees C. The values of the temperature graphs depend, of course, on the specific conditions of the terrain. The set temperature indoors, outside air, supply temperature are taken into account, as a result, the points of the temperature graph are determined.
Suppose a thermometer in your apartment shows an air temperature below 20-22 degrees C. This is a signal to sound an alarm. But first you need to understand that the basis for the presentation of claims should be the heat supply agreement between the heat supply organization and you, that is, the consumer of these services. And most importantly - even at the stage of its conclusion, it is supposed to attach to this agreement a temperature schedule for heating (or heat supply). Without this schedule, it will be difficult to prove that the heat supply organization saves on your comfort and health by not letting heat into your apartment. This is exactly what the question must be raised in court - about the non-fulfillment of contractual obligations by the heat supplying organization. To achieve compliance with the temperature regime, you can also contact the local executive authorities, which should keep under review all the conditions ensuring a normal and comfortable life for citizens.