Even if you are not an IT specialist, but you have your own website, online store or blog, and you value every visitor, then you just need to navigate the modern web analytics services. One of the most powerful analytics services is Google Analytics. At first glance, the structure of Google Analytics may seem complicated, but if you delve into it properly, then understanding Google analytics is no more difficult than with similar services of other companies.
What parameters can be studied using web analytics services
Consider the main parameters of the site, according to which you can get readings using web analytics services:
- traffic sources - links and ads from which visitors get to your site;
- the audience of the site - morphological features (age, gender, etc.) and the location of visitors;
- site usability - the degree of its convenience and usefulness to the user;
- site conversion - the ratio of those users who visited the site and those who performed some action: purchase or subscription;
- the effectiveness of a particular advertising campaign.
Advantages and disadvantages of Google analytics in comparison with other services
Specialists distinguish the following.
- Google counts are considered the most detailed and informative.
- There is an e-commerce tool from Google. If you have an online store, you can look at the statistics for each segment of users and for each product, highlighting the most popular and least popular positions, which will greatly facilitate the selection process for you.
- Scaling sites of any size.
- Data security.
- Integration with AdWords.
- Tracking all advertising campaigns at once and their comparative analysis.
- Google is constantly introducing new technologies to increase the usefulness of analytic readings.
According to user reviews, Google Analytics is more difficult to use than similar Yandex Metrics or LiveInternet. A Russian-speaking user, as a rule, needs more time to set up and learn Google. But the difficulty of using the Google service is a matter of time. Now we’ll analyze in detail how to create an analytics counter, how to configure it, add to the site, synchronize with the site and the AdWords system. We’ll also deal with setting goals, editing views, and analyzing Google queries. Upon a detailed examination, it will become clear that this web tool is not more difficult to use than all the others, it just has an interface that is not quite familiar to us, which is quite easy to understand.
How to create an analytics counter and how to connect Google Analytics to a site
The algorithm is as follows.
- First you need to register an account in the Google system. To do this, log into the system and click the "Create Account" button.
- If it already exists, then the previous item can be skipped, and just log in. Google Analytics is displayed in the general Google toolbar.
- Then go to http://google.com/analytics under your account.
- After that, you need to go to the “Administrator” tab (in the admin panel) and create an account there. A single account can store multiple sites.
- Add your site. In the URL field of the website, enter its full name. It is also important to set the time zone correctly for greater accuracy. If your site operates in several time zones, choose the time zone of the place whose audience you are currently most interested in.
- Then you need to click the "Get Tracking ID" button and copy the received code to yourself.
- It remains to confirm the user agreement, and all - the counter is created. Next, add it to the site.
- To add Google Analytics to your resource, you need to paste the copied code into the body of your site immediately after the closing head tag. Copy the code to each page that you plan to track.
- Then you need to check the code. To do this, go to your site and check the registration of this visit in the counts. The visit should be displayed in real time.
View Settings
After creating and connecting Google Analytics, you need to edit the view. A view is a level of statistics display that provides access to samples and analytical tools. When we create a counter and an account, the view is configured by default, and it displays absolutely all the data on the samples. But usually certain parameters are analyzed, and all the data for one view is not needed. In this case, for convenience, you can use filters in a copy of the original view. The original view, so as not to lose the ability to view all the data, it is better not to delete or apply a filter to it. At first it is recommended to copy the view, and only then apply filters.
To copy a view, you must:
- go to the admin panel;
- select the desired performance;
- select the tab "View Settings" and click on the button "Copy View";
- in the received field, you must enter a new name for the copy, which will differ from the previous one;
- complete the copy by clicking the "Copy View" button.
Then, already in the received copy of the view, you need to apply the necessary filters:
- in the "Views" column, select "Filters" and click the "+ new filter" button;
- select “Create a new filter”.
You can choose a filter from the standard options proposed by the Google Analytics developers, or you can configure it yourself. To select from ready-made filters, you need to put the switch in the "Built-in" position, if you need to configure the filter yourself, then click on the "Select" position accordingly.
Depending on the purpose, the filters are divided as follows.
- Exclusive - filters that allow you to exclude certain IP addresses from displaying. For example, the internal traffic of the company, so as not to violate the statistics of site visits by employees of your company.
- Inclusion filters are filters that allow you to view samples for each directory separately from each other. Or select only one directory that interests you.
How to track the effectiveness of SEO optimization of your site
There are two types of samples for evaluating an SEO site in Google Analytics: a sample for keywords and a sample for search engines. In order to see the value of various search engines for your site you need to open the count “Traffic sources - search engines”.
In this countdown, you can see who and when came to the site for a certain period of time, track all the search queries for which users of search engines found you. It is also possible to evaluate the quality of traffic - see which of the queries bring the most useful visitors to your site.
Keyword countdown is located in the “Traffic Sources - Keywords” tab. In this countdown, you can see general statistics for keywords, as well as separate statistics for paid and unpaid keys. Paid keys are everything related to AdWords and other contextual advertising that you specify in the settings.
Search query analytics can be used to form a search engine, evaluate the effectiveness of existing seo-strategies.
To effectively forecast key queries, you can also use the Google Trends and Google Keyword Planner tools. To link to your site, you need to link your analytics account with a profile in the Google webmaster tools. This will allow you to make Google query analytics even more effective.
AdWords Advertising Analytics
To evaluate advertising campaigns in different search engines, it is recommended to use the built-in analytics services. For example, to view Yandex Direct estimates, it is advisable to use Yandex Metric, and Google Analytics is the most successful tool for evaluating the effectiveness of existing AdWords advertising campaigns. This is not a strict requirement, but users note discrepancies in the performance of various analytical systems due to the different way of calculating data, so it will be easier to do just that.
In order to see the counts you need for AdWords, you first need to link your accounts.
To link the Google Analytics counter to your AdWords account you need to:
- Log in to your AdWords account
- Find the item “Connected accounts” in the settings and bind the resource you need;
- go to "Google Analytics" in the next tab, open the "Administrator" tab and select the site you need;
- Click “Connect” next to the desired tab.
If you did everything correctly, you will have one blue account displayed. You need to click on it once and add the view “All data on the website”.
All accounts are connected. Now you can set the goals you need.
How to set goals
You can choose any visitor’s action on the site in which you are interested. This can be a complete checkout, or adding to the basket, as well as leaving your contact information.
Google Analytics will calculate the conversion of your site depending on the goal: the ratio of the total number of visitors to the number of targeted actions. Therefore, determining the correct goal is very important for building samples.
All target actions can be divided into several types.
- Visiting a specific page on the site. A landing page, or landing page, is a narrowly targeted page that serves to attract a potential client to a certain type of action. Tracking from what sources it is visited most often is extremely important for evaluating the effectiveness of advertising campaigns.
- Being on the site for a certain amount of time. Tracking this parameter will evaluate the usability of the site and the value of the content for the visitor.
- View a certain number of pages on a site. This option also allows you to evaluate the convenience of the interface and interest in the posted content. Fulfillment of the action: actually making a purchase or registration.
- Directly purchase, subscribe or fill out a site form.
Depending on your tasks, you can select one or several goals and configure them in Google Analytics.
All goals can also be divided into primary and secondary. The main goals are those that result in a sale or registration. Auxiliary - these are the goals that are set to obtain intermediate values. You can simply count the number of sales and watch the conversion, but for the successful adjustment of your own marketing strategy, you should set the maximum number of intermediate goals out of all possible. That is, the user went to the site, the user looked at the content for a long time, looked at more than 15 similar items, added a product or several products to the basket, opened the registration form and so on. In this case, you can track at what stage of the sale the majority of customers “fall off”. However, it is worth considering that in one view you can add a maximum of 20 goals.
If you use AdWords, then to optimize contextual advertising it’s worth setting up Google’s Analytics Smart Goals. The principle of the work of smart goals is as follows: Google analyzes all the actions of visitors on the site and identifies those that most often lead to the achievement of the target and, depending on the input data, optimizes the display of AdWords advertising campaigns.
Adding Goals to Google Analytics
The following actions must be carried out.
- first you need to go to the admin panel and find the “Goals” item;
- You need to add a goal by clicking "+ goal";
- in the field that appears, enter the name of the page;
- when the goal is selected, select the type “Target” and click “Next”;
- in the drop-down list, select "Regular Expression" and enter the page name (its head tag);
- then you need to save the resulting setting.
All this will allow you to watch the conversion directly from your AdWords account.
Create and use remarketing lists
Remarketing is the display of advertising to users who have either already been on your site or have already made a targeted search query that could lead them to your resource.
Google Analytics can be used to create search remarketing lists. That is, you saw the most conversion request in the “Traffic Sources” sample. You can configure remarketing on it. Even if the user has not visited the site or left the site for the first time, it’s worth adding it to the remarketing list, as this client is warm. It is possible that re-showing your offer will result in a sale.
To set up remarketing in analytics, there is an interesting Smart List tool - a remarketing audience created using machine learning on the same principle as smart goals. The neural network analyzes Google’s search queries and, based on user actions, determines the likelihood of a future conversion. At the same time, a large amount of data is calculated. If you have more than 10,000 site views per month, then the service will generate smart lists based on the behavior of visitors to your site. If you have less traffic, then the neural network takes information about user behavior from company sites similar to yours.
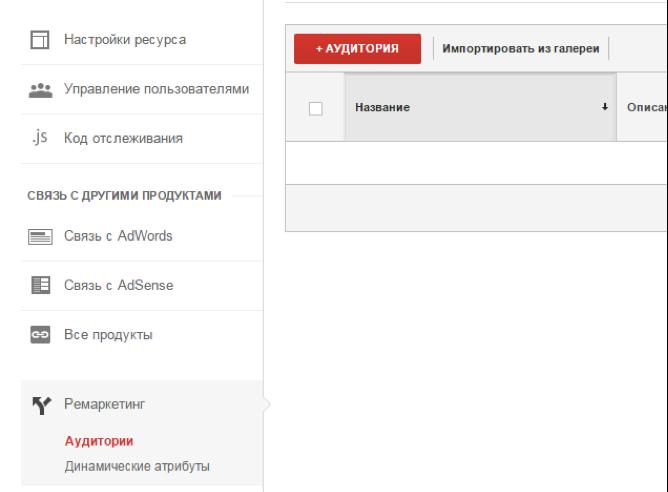
Setting up a Smart List in Google Analytics is easy. You need to go to the “Admin” tab, select the “Remarketing” section and create an audience by choosing the “Smart List” value.
This audience must then be added to AdWords targeting.
All this does not take much time, but in some cases it very effectively increases the conversion of the site.
Ways to use the service conveniently
We were convinced that the "Analytics" from "Google" is not only informative, but also quite convenient to use the tool. You can simplify its use in an active life.
Firstly, if you need to monitor traffic and sales non-stop, it is worth installing a Google Analytics mobile gadget. This will allow you to always be in touch with your own site, and quickly solve problems that arise, even if you are not at the workplace.
Secondly, you can configure the sending of all samples to your mail.
To do this, you must:
- open report;
- press the button "Open access" under the name of the count;
- Add recipient addresses to the To field;
- select the frequency of sending the count, in the "Advanced Settings" section, mark the option in the "Period" field (for example, if you want to send the count every week for two months, then select the week in the "Frequency" field and write two in the "Period" field months);
- send by clicking on the appropriate button.
Depending on the frequency and period settings, the countdown will automatically come to you according to the schedule that you configured.