Candlestick charts were invented by a 18th century Japanese rice trader. Munehisa Homm. His market mastery was legendary. Over the centuries, his methods of technical analysis have undergone further additions and changes, and today they are applied to modern financial markets. The Western world got acquainted with this method thanks to the book of Japanese candlestick charts by Stephen Neeson.
Today they are part of the technical analysis tools for all trading platforms and are supported by charting programs of each financial trader. The depth of the information displayed and the simplicity of the components provided the indicator with popularity among professional market participants. And the ability to combine several candles into a candlestick pattern of a reversal and the continuation of the trend is an effective tool for interpreting price changes and forecasting them.
How to read a chart?
The candle consists of three parts: the upper and lower shadows and the body. The latter is painted in green (white) or red (black) color. Each candle represents price data for a specific period of time. For example, a 5-minute candlestick displays data on transactions concluded within 5 minutes. Each indicator represents 4 prices: open, close, minimum and maximum. The first of them corresponds to the first deal of the period, and the second to the last. They form the body of the candle.
The maximum price is represented by a vertical line extending from the upper body, called a shadow, tail or wick. The minimum is depicted by a vertical line emanating from the lower body. If the closing price is higher than the opening, the candle turns green or white, which means an increase in the net price. Otherwise, its red or black color indicates a depreciation.
Application in technical analysis
Candles tell about the course of the battle between bulls and bears, buyers and sellers, supply and demand, fear and greed. It is important to keep in mind that all candlestick analysis models need confirmation based on the context of previous and subsequent data. Many newcomers make the mistake of discovering a lonely figure without taking into account past and future prices. For example, the “Hammer” indicates a trend reversal if it occurs after three previous bearish candles. And in the vicinity of "flat" indicators, it is useless. Therefore, an understanding of the “history” that each figure tells is extremely necessary for confident orientation in the mechanics of Japanese candles. These patterns tend to be repeated all the time, but the market often tries to trick traders when they lose sight of the context.
Coloring brings a share of emotionality to the diagrams. For best results, it is important to ensure that other indicators are taken into account. The article provides candlestick models that are most popular with traders.
"Grip by the belt" - what is it?
The Candlestick Belt Candlestick model is considered a secondary trend indicator that can indicate both bullish and bearish trends depending on the nature of the pattern and the direction of market movement in which it appears. It is a candle with a high body and small shadows (or without them), which indicates the strength of bullish or bearish activity. With an uptrend, it represents a potential peak of a reversal and consists of a red figure with the opening level at the maximum and closing at the minimum price. The shadows are either very small or absent. In a downtrend, it consists of a long green candle and indicates a bullish reversal. At the same time, the size of the indicator indicates the probability of a change in the direction of market movement: the larger the body, the higher it is.
Both bullish and bearish “Capturing by the belt” are more reliable when they appear near the extreme points of the market, which are indicated by the lines of support and resistance, moving averages, etc. The figure becomes even more important in the “Curtains of Dark Clouds” or a bearish or bullish Absorption.
"Hammer"
This figure is an indicator of a bullish reversal. This is one of the most (if not the most) widely traded Forex candlestick pattern. It is used to determine if the trend has reached the bottom, followed by a price increase, which traders use to enter a long position.
A "hammer" is formed at the end of a downward movement of the market and indicates the near bottom. The candle has a lower shadow, forming a new low of the downtrend, and the closing price exceeds the opening price. The tail should be at least 2 times longer than the body. He presents a situation where long positions finally begin to open, and short ones close, and speculators fix their profits. The increase in trading volume is another confirmation of Hammer. But for final confidence, it is important that the next candle closes above the minimum of the previous one and preferably above the body.
A typical buy signal will be the opening above the maximum of the indicator following the Hammer, and the stop order is placed under the body or the shadow of the figure. Of course, you need to check with such momentum indicators as MACD, RSI or stochastic.
"Shooting star"
This is a candlestick pattern of a bearish reversal, which indicates the achievement of a peak or top of the trend. It is the exact inverse version of Hammer. A “shooting star” should be formed after at least three or more consecutive green candles indicating an increase in demand. In the end, market participants lose their patience and chase the price to new highs before realizing that they have overpaid.
The upper shadow should be 2 times larger than the body. This indicates that the last buyer entered the asset when the players closed their positions, and sellers began to act in the market, pushing the price down, closing the candle at or near the opening price. This is, in fact, a trap for late bulls who have pursued the trend for too long. Fear is at its highest point because the next candle should close at the level of a shooting star or lower, which will lead to a panic sale, as late buyers will struggle to get rid of the assets they acquired in order to fix the losses.
A typical signal for a short sale is formed when the minimum of the next candle is broken, and the stop is set at the upper level of the body or at the maximum of the Shooting Star tail.
Doji
This is a reversal pattern of candlestick analysis, which may be bullish or bearish depending on the previous context. It has the same (or close) opening and closing prices with long shadows. The figure is like a cross, but it has a very small body. Doji is a sign of indecision, but also a notorious line in the sand. Since this figure, as a rule, indicates a change in trend, the direction of the previous indicators may give an indication of which direction it will occur.
Candlestick model "Gravestone" is a "Doji", the opening and closing prices of which are equal to the lowest rate of the session, that is, when there is no lower shadow.
If the preceding indicators were bullish, then the next one, which closed below the Doji body, when breaking through the minimum of the latter, signals the need to sell. Stop order should be set above the maximum figure.
If the previous candles were bearish, then the Doji will most likely form a bullish reversal. This causes entry into a long position above the body or maximum of the indicator with a stop order below the minimum of the figure.
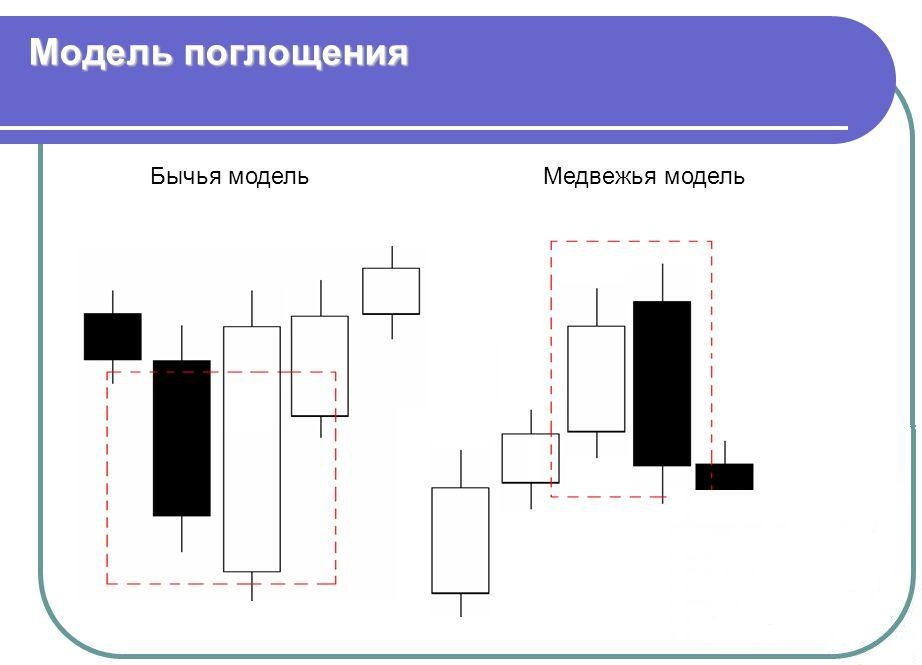
Bullish Absorption
This is a large green candle, which completely covers the entire previous red row. The larger the body, the more extreme the circulation becomes. It should completely cover the red bodies of all previous candles.
The most effective bullish “Absorption” is formed at the end of the downtrend with a sharp rebound, which causes panic among players with a short position. This motivates many to take profits, which puts even more consumer pressure. Bullish “Absorption” is a candlestick model of a reversal of a downtrend or continuation of an uptrend when it forms after a small pullback. The scope of operations must at least double the average level so that the figure forms the most effective form.
A buy signal is formed when the next candle exceeds the maximum of the bullish “Absorption”.
Bearish Absorption
Just as a massive tidal wave completely covers the island, this candle completely swallows all the previous green indicators. This is a strong sign of a trend change. His body overshadows the body of the previous green candle. The most powerful effect is the figure, the dimensions of which exceed the previous indicators, along with the upper and lower shadows. Such a candlestick Absorption pattern may be a sign of tremendous sales activity during a panic reversal from bullish to bearish market sentiment.
The previous price increase supports modest optimism of buyers, as trade should take place near the top of an increasing trend. The bearish Absorption candle actually opens higher, giving hope for a new rise, since it initially indicates a more bullish mood. Nevertheless, sellers are very aggressive and extremely quickly reduce the price to the level of opening, causing some concerns among those who open a long position. Sales increase as the price drops to the minimum of the previous close, which then causes some panic, as most of yesterday's buyers are at a loss. The magnitude of the reverse is dramatic.
Bearish “Absorption” is a reversal model of candlestick analysis when it forms on uptrends, as it activates an increasing number of sellers. A signal to start approaching a short position is formed when the next indicator exceeds the lower level of the figure. Under the current downward movement of the market, the bearish “Absorption” can occur at the rebound of recovery, thereby resuming the decline at an accelerated pace due to the attraction of new buyers trapped in the rebound. As in all candlestick models, it is important to monitor the volume, especially in this case. In order for the situation to have the greatest impact, the volume of operations must be at least twice the average level. Software algorithms are notorious for spurious closing signals due to fictitious bearish Absorption candles, which many traders fall into this trap.
Bullish Harami
This is another indicator of the candlestick reversal pattern. It looks like the reverse version of the bearish Absorption. The small “Harami” figure should be preceded by a large absorbing red Japanese candlestick, representing the lowest point of the sequence, which indicates the final sale. Harami must be traded within the Absorption range. The small size of her body maintains sellers' confidence that the price will fall again, but instead, it stabilizes and forms a rebound rebound, which will take players to lower by surprise.
The figure is a subtle clue that does not cause sellers concern until the trend begins to slowly change. It is not as intimidating or dramatic as bullish absorbing candles. Harami’s thin body makes the model very dangerous for short sellers, since the turn takes place gradually and then quickly accelerates.
A buy signal is generated when the next candle rises above the maximum of the previous one, and stop orders can be set below the lows of the figure.
Bear Harami
This is the reverse version of the previous model. The absorbing candle preceding the bearish Harami should completely overshadow its range, just as David defeated Goliath. The candlestick pattern is formed at the peak of the uptrend, when the previous green candlestick with a large body creates a new maximum. With the formation of a small “Harami,” customer pressure is gradually dissipating. Despite the gradual slowdown in demand, long-position holders continue to assume that the pullback is simply a pause before the resumption of price increases.
After the close of Harami, the next candle closes lower, which starts to bother buyers. When the minimum of the previous absorbing figure breaks through, a panic sale begins - long positions are closed to reduce further losses.
A signal to start selling is formed when the lower part of the absorbing candle is broken, and the stops are placed above the Harami maximum.
"Hanged"
Candlestick and Hammer candlestick patterns look similar, but the first is formed at the peak of the uptrend, and not at the bottom of the downtrend. The “Hanged Man” has a body 2 or more times smaller than the lower shadow, and the upper shadow is very small or absent. The figure is different from the Doji because it has a body that is formed at the top of the range. For some reason, buyers plucked a potential star and raised the price to close the upper range and maintain a bullish mood. Often this is done artificially. However, the truth becomes apparent when the next session closes under the Hanged Man figure as sales accelerate.
This candlestick trend reversal model is most effective at the peak of parabolic price spikes consisting of four or more consecutive green figures. Most indicators of a bearish reverse are formed on the “Shooting Stars” and “Doji”. The hanged ones are unusual because they are a sign of a big buyer who falls into the trap of trying to maintain momentum or simulate market activity in order to increase liquidity for the sale.
The “hanged man” signals a possible peak of the uptrend, as the rising players who chased the price look and wonder why they have been doing this for so long. The situation is reminiscent of an old cartoon when a coyote chases a bird until he realizes that he has stepped over the edge of a cliff and looks down before falling.
A signal to open a short position is generated when the minimum of the Hanged person is broken, and the stop order is set above its maximum.
"The curtain of dark clouds"
This formation is made up of three trend reversal candles. The "curtain of dark clouds" forms a new maximum of the upward movement of the market when it breaks the closing price of the previous session, but closes in red, as sellers enter the game late. This indicates that buyers have taken active measures and closed their positions even after reaching a new peak. Candles "Veils" should have bodies with closing prices below the middle of each previous indicator. This is what distinguishes the figure from such bearish reversal candlestick patterns such as Doji, Shooting Star, or Hanged Man. Thus, the previous candle, the "Veil" and the next make up one combination. The figure must be preceded by at least 3 consecutive green indicators.
Sales prevail and new buyers fall into the trap. If the next session is not able to create a new high (above the "Veil") and breaks the minimum of the third candle, then this is a signal for a short sale. Long positions begin to panically close in order to fix losses. A stop order should be placed above the upper shadow of the Veil.
"Clearance in the clouds"
The candlestick pattern is the opposite of the "Veils of Dark Clouds." It indicates a new low of a downtrend that has overcome the closing price of the previous session. However, the current closure is at a higher level. In this case, the center of the body of each candle "Gleam" should be above the middle of the previous one. Similarly to the "Veil", before the "Clearance in the clouds" should be at least 3 red indicators.
A buy signal is generated when the subsequent candlestick does not form a new minimum and the maximum of the third candlestick is exceeded. The stop order must be set below the lowest price of "Clearance".