Mathematical statistics is a methodology that allows you to make informed decisions among uncertain conditions. The study of methods for collecting and systematizing data, processing the final results of experiments and experiments with mass randomness, and detecting any patterns is what this section of mathematics does. Consider the basic concepts of mathematical statistics.
Difference with probability theory
Methods of mathematical statistics are closely intersected with probability theory. Both branches of mathematics are engaged in the study of numerous random phenomena. Limit theorems relate two disciplines to each other. However, there is a big difference between these sciences. If probability theory determines the characteristics of a process in the real world on the basis of a mathematical model, then mathematical statistics do the opposite - it sets the properties of the model on the basis of the observed information.
Stages
The application of mathematical statistics can be carried out only in relation to random events or processes, and more precisely, to data obtained from observation of them. And this happens in several stages. First, the data of experiments and experiments undergo certain processing. They are arranged for clarity and analysis convenience. Then, an exact or rough estimate of the required parameters of the observed random process is made. They can be:
- assessment of the probability of an event (its probability is initially unknown);
- studying the behavior of an indefinite distribution function;
- assessment of mathematical expectation;
- variance estimate
- etc.
In the third stage, it is possible to single out the verification of any hypotheses posed before the analysis, that is, obtaining an answer to the question of how the experimental results correspond to theoretical calculations. In fact, this is the main stage of mathematical statistics. An example would be to consider whether the behavior of the observed random process is within the normal distribution law.
General population
The basic concepts of mathematical statistics include general and sample aggregates. This discipline deals with the study of the set of some objects regarding a property. An example is the work of a taxi driver. Consider these random variables:
- congestion or number of clients: per day, before lunch, after lunch, ...;
- average travel time;
- the number of applications received or their attachment to the city districts and much more.
It is also worth noting that one can investigate the totality of such random processes, which will also be a random variable over which observations can be made.
So, in the methods of mathematical statistics, the whole set of studied objects or the results of all kinds of observations that are carried out under identical conditions over a taken object is called the general population. In other words, mathematically more strictly, this is a random variable that is defined in the space of elementary events, with the class of subsets indicated in it, whose elements have a known probability.
Sampling frame
There are cases when it is impossible or impractical for some reason (cost, time) to conduct a continuous study to study each object. For example, to open each jar of sealed jam to control its quality is a dubious decision, and an attempt to evaluate the trajectory of each air molecule in a cubic meter is impossible. In such cases, the method of selective observation is used: from the general population, a selection (usually randomly) of a certain number of objects is made, and they are subjected to analysis.
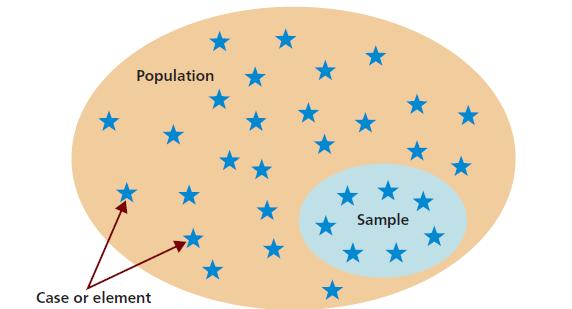
These concepts may seem complicated at first. Therefore, in order to fully understand the topic, it is necessary to study the textbook of V. E. Gmurman, "Probability Theory and Mathematical Statistics." Thus, a sample population or a sample is a series of objects randomly selected from the general set. In strict mathematical language, this is a sequence of independent, uniformly distributed random variables, for each of which the distribution coincides with that designated for the general random variable.
Basic concepts
Let us briefly consider a number of other basic concepts of mathematical statistics. The number of objects in a population or sample is called volume. The sample values that are obtained during the experiment are called sample implementations. In order for a population based estimate of a sample to be reliable, it is important to have a so-called representative or representative sample. This means that the sample must fully represent the population. This can only be achieved if all elements of the population have an equal probability of being in the sample.
Samples are distinguished with return and without return. In the first case, in the contents of the sample, the repeated element returns to the general set, in the second - no. Typically, sampling without returns is applied in practice. It should also be noted that the size of the general population always significantly exceeds the sample size. There are many options for the sampling process:
- simple - elements are randomly selected one at a time;
- typed - the general population is divided into types, and a choice is made from each; an example is a survey of residents: men and women separately;
- mechanical - for example, select every 10th element;
- serial - the choice is made by a series of elements.
Statistical distribution
According to Gmurman, probability theory and mathematical statistics are extremely important disciplines in the scientific world, especially in its practical part. Consider the statistical distribution of the sample.
Let us have a group of students in which testing in mathematics was conducted. As a result, we have a totality of estimates: 5, 3, 1, 4, 3, 4, 2, 5, 4, 4, 5 - this is our primary statistical material.
First of all, we need to arrange it, or conduct a ranking operation: 1, 2, 3, 3, 4, 4, 4, 4, 5, 5, 5 - and get, thus, a variation series. The number of repetitions of each of the estimates is called the estimation frequency, and their relation to the sample size is called the relative frequency. We compile a table of the statistical distribution of the sample, or simply a statistical series:
or
| a i | 1 | 2 | 3 | 4 | 5 |
| p i * | 1/11 | 1/11 | 2/11 | 4/11 | 3/11 |
Let us have a random variable, over which we will conduct a series of experiments and see what value this quantity takes. Suppose she took the value a 1 - m 1 time; a 2 - m 2 times, etc. The volume of this sample will be m 1 + ... + m k = m. The set a i , where i varies from 1 to k, is a statistical series.
Interval distribution
In the book of V. E. Gmurman "Probability Theory and Mathematical Statistics" an interval statistical series is also presented. Its compilation is possible when the value of the trait under investigation is continuous in a certain interval, and the number of values is large. Consider a group of students, or rather, their growth: 163, 180, 185, 172, 161, 171, 189, 157, 165, 174, 180, 181, 175, 182, 167, 159, 173, 171, 164, 179, 160, 180, 166, 178, 156, 180, 189, 173, 174, 175 - a total of 30 students. Obviously, human growth is a continuous quantity. We need to determine the interval step. For this, the Sturges formula is used.
| h = | max - min | = | 190 - 156 | = | 33 | = | 5.59 |
| 1 + log 2 m | 1 + log 2 30 | 5.9 |
Thus, the size of the interval can be taken as 6. Also, it should be said that the value 1 + log 2 m is a formula for determining the number of intervals (of course, with rounding). Thus, it is obtained by the formulas 6 intervals, each of which has a size of 6. And the first value of the initial interval will be the number determined by the formula: min - h / 2 = 156 - 6/2 = 153. Let's make a table that will contain the intervals and the number of students whose growth fell in a certain interval.
| H | [153; 159) | [159; 165) | [165; 171) | [171; 177) | [177; 183) | [183; 189) |
| P | 2 | 5 | 3 | 9 | 8 | 3 |
| P * | 0.06 | 0.17 | 0.1 | 0.3 | 0.27 | 0.1 |
Of course, this is far from all, for there are much more formulas in mathematical statistics. We have considered only some basic concepts.
Distribution chart
The basic concepts of mathematical statistics also include a graphical representation of the distribution, which is clear. There are two types of graphs: a polygon and a histogram. The first is used for a discrete statistical series. And for continuous distribution, respectively, the second.