The tabular form is used to present information in a generalized form, as a rule, for subsequent data analysis. Excel spreadsheets allow you to automate the calculation process and data management, graphically present the results of information analysis.
When the program starts, an empty workbook appears on the screen, which is a set of three sheets (by default), each of which has a table. Rows of the table are numbered from 1, and columns are indicated in Latin letters, starting with A. In total, more than 65 thousand rows and more than 250 columns are placed on the sheet. Excel spreadsheets consist of cells designated by type A1, where A is the column designation, 1 is the row designation. You can also select a block of cells. For example, A1: C4 is a designation of a set of cells that fall into a rectangular region, the corners of which are cells A1 and C4.
Formatting characters in cells is very similar to a text editor, only Excel has fewer parameters that can be changed. All cell manipulations can be performed using the "Format Cells" dialog.
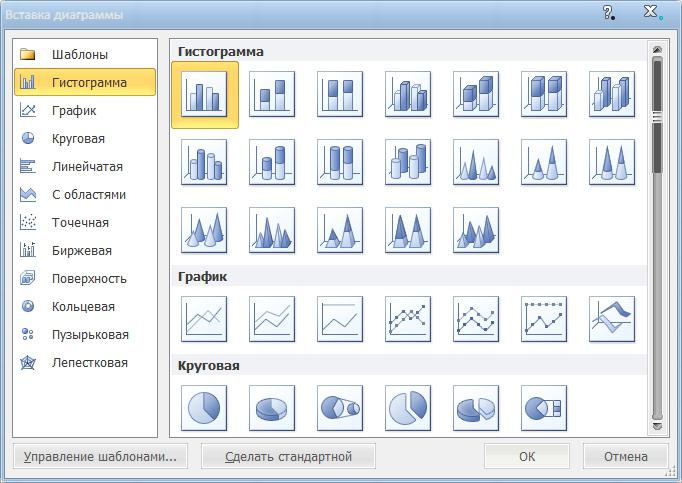
As a rule, after processing the data, it becomes necessary to present the results in graphical form. For this, Excel has ample opportunities. Bar charts, graphs, scatter and pie charts. Each of them is used in certain cases. If you want to graphically show the dependence of two data series, you can use a graph or scatter chart. If you want to show parts of something whole, then you can build a pie or ring diagram. In the latter case, for the convenience of understanding the diagram, it is desirable to take the number of values in the range of 5-6.
The cells can contain the initial data in the form of text, numbers (integers, fractional, percent, etc.), as well as formulas. Any formula starts with the “=” sign and contains the designations of the table cells, signs of arithmetic operations, or standard functions. Microsoft Excel has 10 categories of functions: financial, date and time, mathematical, statistical and others. This is done for the convenience of using their list, in which all functions are arranged alphabetically (first in English, then in Russian).
Excel spreadsheets also have the ability to sort and filter data. If you enter any long list in the table, then you can simply work with it if you arrange the rows in ascending or descending order. Moreover, sorting can be carried out on any column or even several. The filter allows you to select rows by some attribute (condition). For example, it can display on the screen only those values that are greater than zero.
When printing Excel spreadsheets can be easily adjusted to any sheet size, increasing or decreasing the scale. By default, the table borders are not visible when printing, therefore, if necessary, you can display the grid through the "Format Cells" dialog (the "Border" tab).
Microsoft Excel 2010 is part of the Microsoft Office 2010 package, which includes about a dozen other useful applications. All these programs have a similar interface, which simplifies the user’s learning process.